How Simvora works.
From scattered accounts to a plan you can stress-test — the whole journey, screen by screen.
Every account, one read-only view.
Link your brokerages, banks, and crypto in a couple of clicks. Simvora connects through SnapTrade and Teller with read-only access — we can see balances to model them, never move a dollar. Your holdings refresh on their own, so the picture stays current without a spreadsheet.
- Brokerages via SnapTrade — strictly read-only
- Banks and cash balances via Teller
- Crypto and manual assets, all in one place
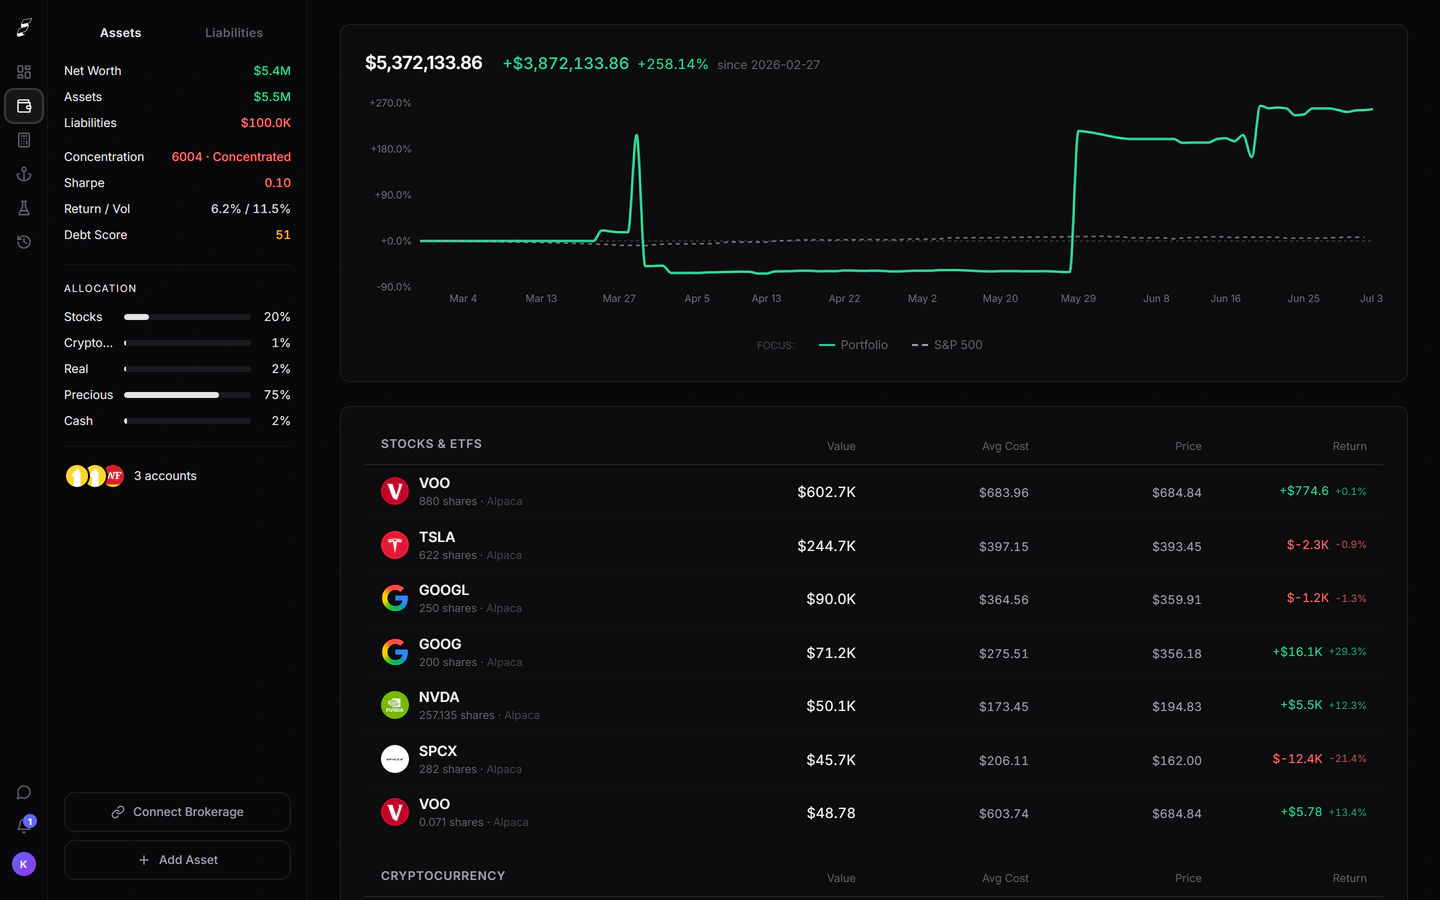
Your whole financial life, on one dashboard.
Net worth over time on a log scale, so decades of compounding read as a clear line instead of a flat start. An allocation chart that ties every slice back to the holding behind it, live market prices — precious metals valued at today’s price, not what you paid — and a Current Finances tab that itemizes every asset and liability, one click to the details.
- Net-worth history, including connected balances
- Allocation by category, updated live
- Assets and liabilities, fully itemized
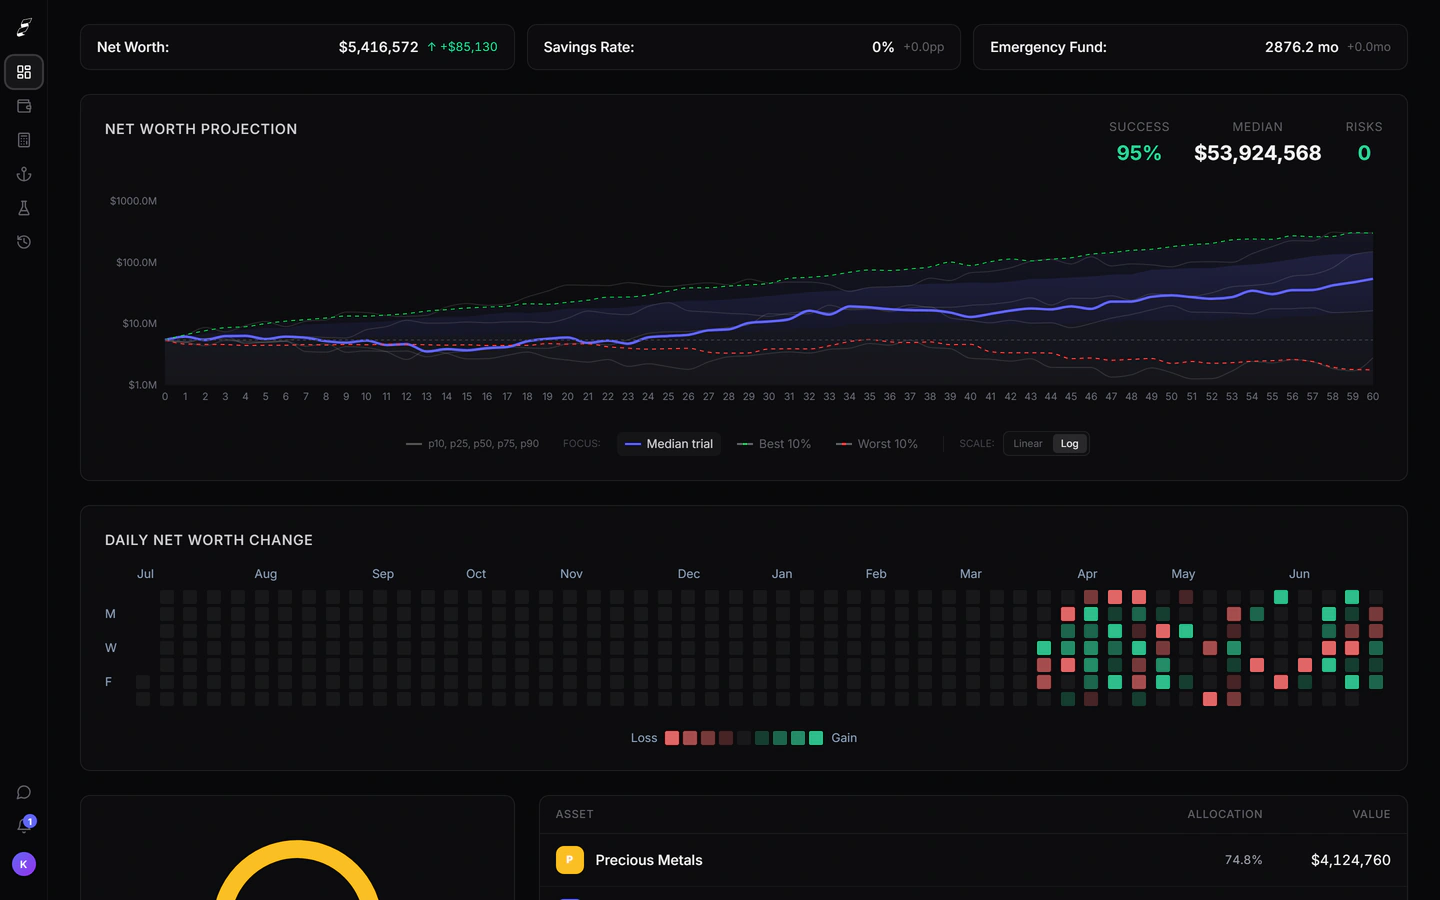
An AI copilot that already knows your numbers.
A chat rail sits beside every screen — and it’s wired into your real data. It reads your net worth, cash flow, allocation, and your latest simulation, so its answers are about you, not a generic FAQ. Pull a live stock price with a cited source, pressure-test a recession, or just name a fear: “Am I OK if I lose my job?”
- Grounded in your live balance sheet, cash flow, and projections
- Pulls live market data and cites its sources
- Bring it the anxious questions, not just the quant ones
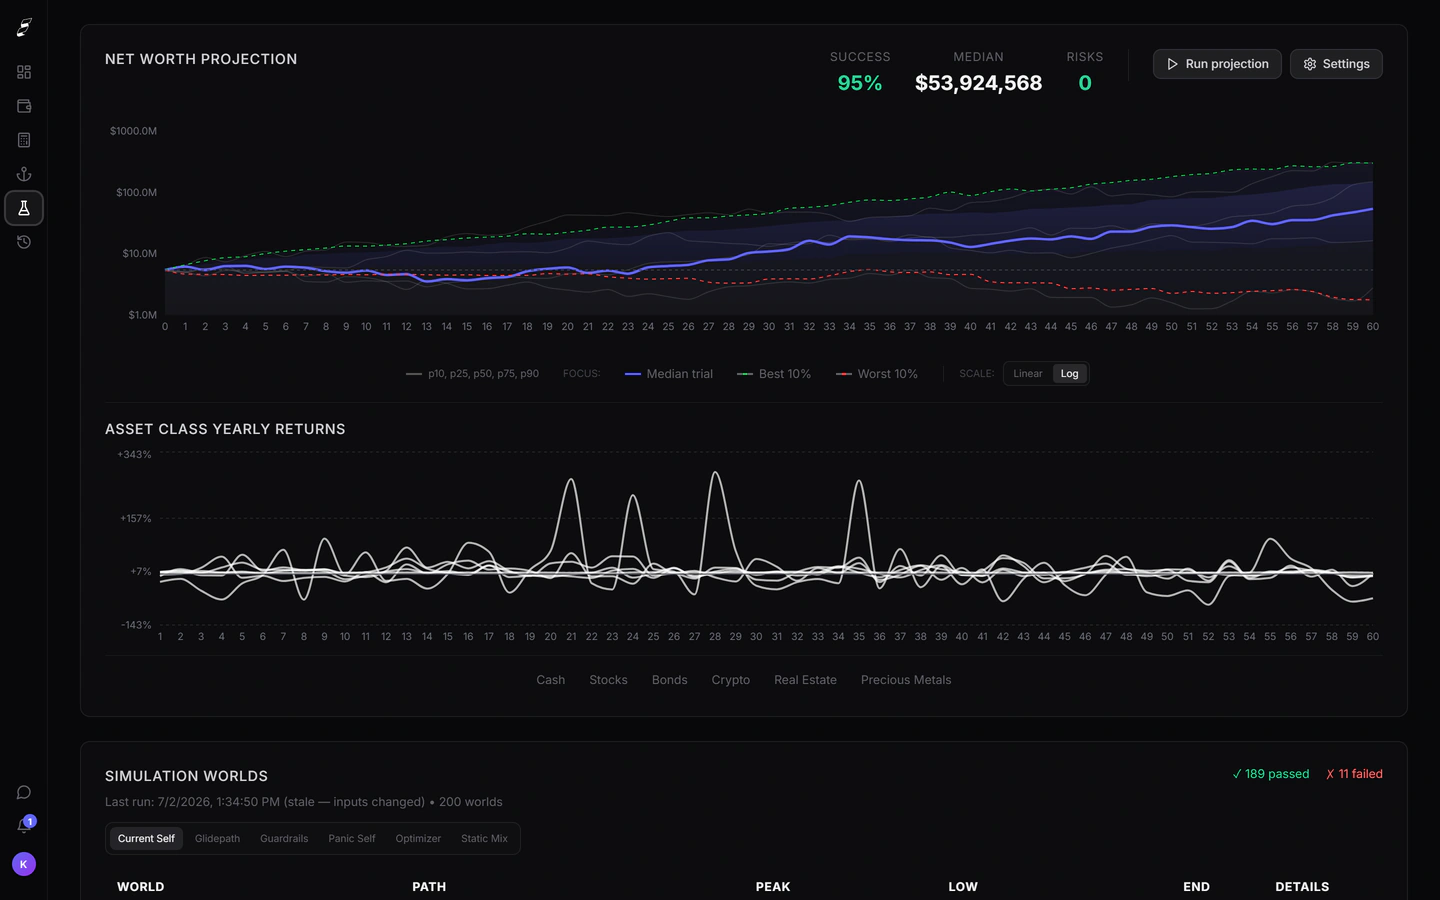
Not one guess — a thousand futures.
Virtual Scenarios runs your plan through a 1,000-path Monte Carlo simulation and shows the odds, not a single number. Test a market crash, a career change, or a different withdrawal rate, and watch a point estimate become a probability of success you can actually plan against.
- 1,000-path Monte Carlo projection
- What-if scenarios, compared side by side
- A probability of success, not a point estimate
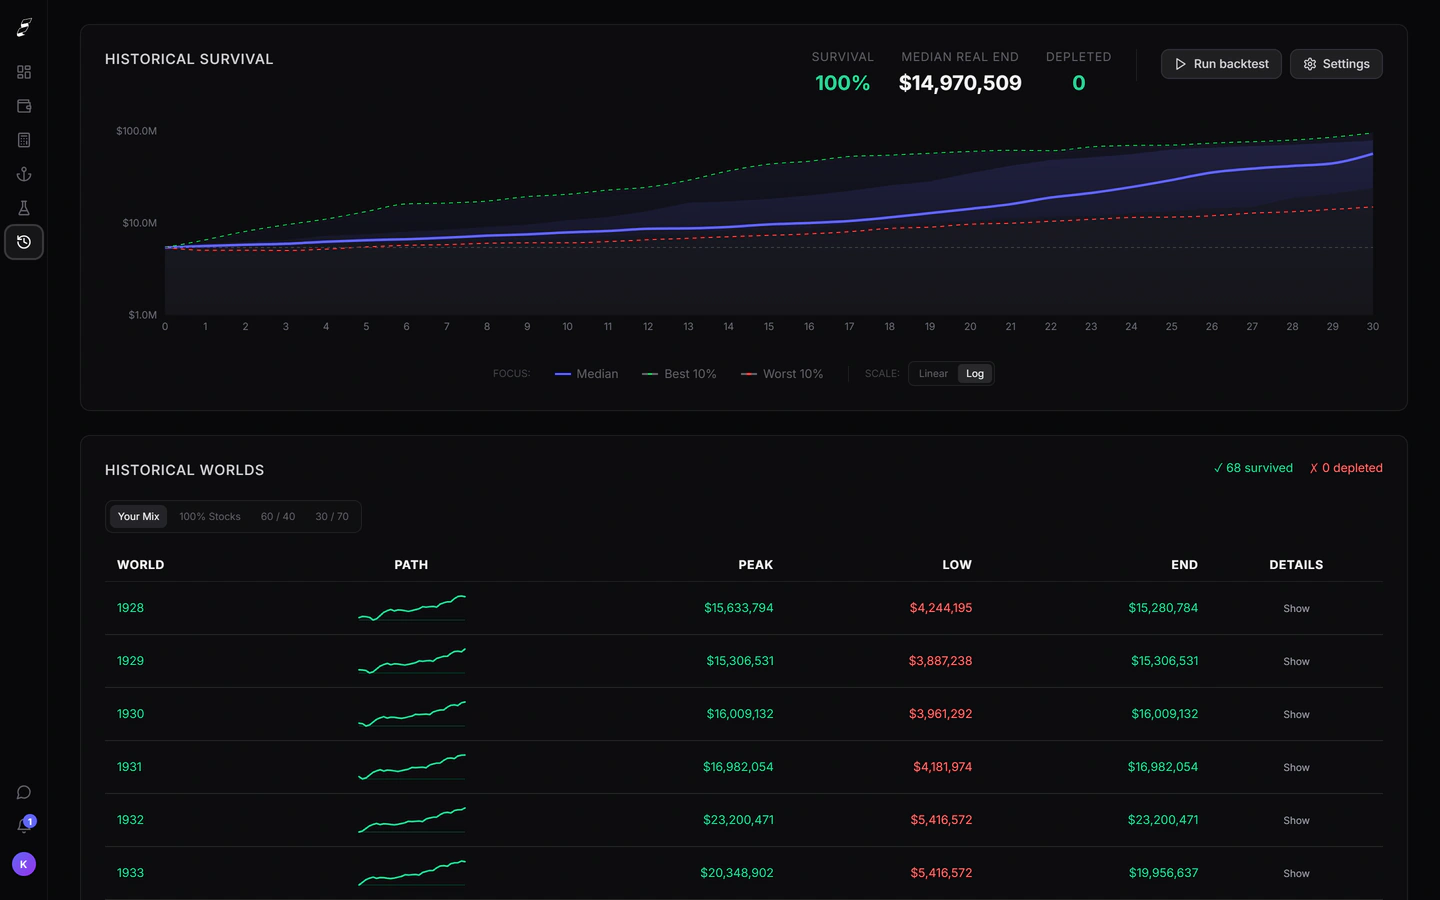
Would your plan have survived the real past?
Backtesting replays your allocation through every real market start year since 1928 — actual history, not simulated returns — and reports how often a plan like yours would have lasted a full retirement. Compare your mix against 100% stocks, 60/40, and a conservative 30/70 on identical years, then open any single start year to see its full path and deepest drawdowns.
- Every market start year since 1928
- Survival rate vs 100/0, 60/40, and 30/70
- Drill into any single year’s path